
Climate-Related Information Disclosure
(Disclosure Based on TCFD Recommendations)
Disclosure Based on the TCFD Recommendations (As of the end of March 2025)
In addition to our efforts to address climate change, we recognize the importance of information disclosure, and we continue to disclose information in line with the spirit of the TCFD (Task Force on Climate-related Financial Disclosure) Recommendations, which the Bank of Kyoto Group endorsed in October 2021.
Governance
Please refer to “Governance System Concerning Sustainability.”
Strategy
Risks and opportunities
We believe that climate change will have a significant impact on social and economic activities and may have a significant impact on our business activities.
The Group has identified the impact on our customers’ assets and businesses and on the Group’s assets and businesses as a result of dividing climate change-initiated events into physical events (physical risks) and events related to economic and social transitions (transition risks) and analyzing the effects.
On the other hand, we recognize that efforts to mitigate impact events that may occur to our customers’ assets and businesses represent a business opportunity for the Group. The recognized risks and opportunities are as follows.
| Factor | Risk | Occurrence phenomena | Impact | Response risk | Opportunity | |
|---|---|---|---|---|---|---|
| Climate change | Physical risk | Natural disasters due to torrential rain, etc. | Damage to customer assets | Damage to collateral value and deterioration of customers’ business performance | Credit risks | Increased consulting opportunities Increased financing opportunities |
| Damage to the Group’s assets | Suspension of the Group’s business | Operational risks | – | |||
| Transition risk | Legal system changes and strengthened regulations Changes in the supply-demand balance Technological conversion |
Incurrence of additional costs Inability to respond | Deterioration of customers’ business performance | Credit risks | Increased consulting opportunities Increased financing opportunities |
|
Scenario analysis
The results of the physical and transition risk scenario analysis based on the TCFD Recommendations are as follows. For physical risks, the impact of flood damage was analyzed, taking into consideration the frequency of occurrence and the degree of impact. For transition risks, the power sector and the automotive sector were the subject of the analysis due to their high greenhouse gas emissions and the significant impact on business associated with the transition to a decarbonized society. In each analysis, the impact on the Group’s financials was limited. Scenario analysis is conducted under certain assumptions, and we will continue to work to expand the scope and sophistication of our analysis.
| Physical risk | Transition risk | |
|---|---|---|
| Scenario | RCP 8.5 scenario (4°C scenario) according to the Intergovernmental Panel on Climate Change (IPCC) | NZE scenario (1.5°C scenario) according to the International Energy Agency (IEA) |
| Subject | Business loan recipients (excluding large companies) | Business loan recipients belonging to the power and automotive sectors |
| Analysis method | Estimate the financial impact and collateral value impact on the target customer in the event of flooding based on hazard map data, and calculate the increase in credit costs | Estimate the change to the financials of the target customer, taking into consideration the effect of the introduction of a carbon tax, etc., based on the transition scenario, and calculate the increase in credit costs from the transition in debtor classification |
| Analysis period | Until 2050 | |
| Analysis result | Additional credit costs that may be incurred: Up to ¥5.2 billion | Additional credit costs that may be incurred: ¥5.4 to ¥11.2 billion cumulative |
Carbon-related assets
We recognize the four industry groups that are considered vulnerable to climate change, namely “energy,” “transportation,” “materials and buildings,” and “agriculture, food, and forest products,” and have identified the loans to these industries.
| Energy | Transportation | Materials and buildings | Agriculture, food, and forest products | |
|---|---|---|---|---|
| Percentage* | 1.8% | 3.4% | 19.4% | 3.3% |
- *Balance of loans to the four industry groups as a percentage of the Bank of Kyoto’s total loans and bills discounted
〈Examples of subject industries〉
| Energy | Transportation | Materials and buildings | Agriculture, food, and forest products |
|---|---|---|---|
| Coal, oil, and gas Electricity (excluding renewable energy) | Air transportation Maritime transportation Land transportation Automotive |
Metals and mining Chemicals Building materials and capital goods Real estate management and development |
Beverages and food Agriculture Paper manufacturing and forestry |
Risk management
We recognize that risks arising from climate change may materialize as risks in each risk category, such as credit risk and operational risk, as previously mentioned risks and opportunities, and may affect the Group’s performance and financial condition.
The Group has established a system to manage risks assessed by risk category in an integrated manner and to manage various risks arising from climate change within the framework of integrated risk management.
We have also established an Environmental Policy for all corporate activities and a Policy on Loans and Investments for Achieving a Sustainable Society for investments and loans, which is our main business sector, to reduce risk by proactively addressing environmental issues, including climate change, through our business activities and environmental conservation activities.
Indicators and targets
We have set “carbon neutrality by FY2050” as a long-term climate change-related target, and are working on the following two immediate targets for FY2030.
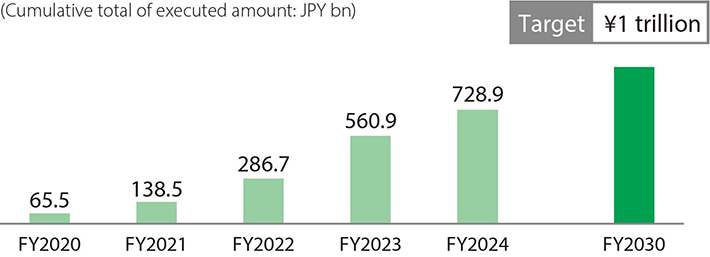
[Sustainable finance target]
Execute ¥1 trillion in financing between FY2020 and FY2030
We define “sustainable finance” as “finance that contributes to the resolution of environmental, social, and economic issues by increasing or creating positive impacts or reducing or avoiding negative impacts.”
In addition to green and sustainable finance (lending and investment) in accordance with international frameworks, we have introduced loan programs and products such as the Sustainability Linked Loan (Kyoto Version) and Kyogin Sustainability Linked Loan — Seven Targets, which are easy for SMEs to use, in order to support their efforts to realize a sustainable society from a financial perspective.
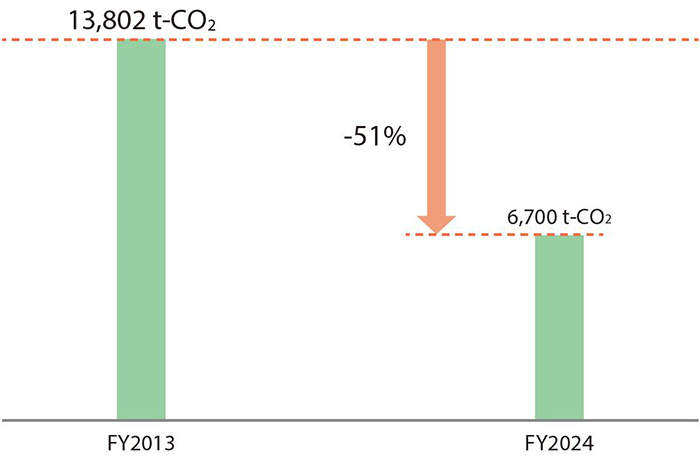
[CO2 emission reduction target]
Reduce by 50% compared to FY2013 by FY2030 (Scope 1 and 2)
In addition to continuing initiatives such as switching to energy-efficient equipment and conserving electricity, in February 2024, we switched the electricity used at five headquarters locations, including the Bank of Kyoto head office, to carbon-free electricity derived from renewable energy sources generated in Kyoto Prefecture. Taking into account the fact that the FY2024 results reached the target level ahead of schedule, we will continue to study specific initiatives to achieve a carbon-neutral society.
Calculation of greenhouse gas emissions under the GHG Protocol
The Group is working to expand the scope of measurement of greenhouse gas (GHG) emissions resulting from its business activities, and in April 2024 we introduced C-Turtle® FE, a GHG emissions calculation tool provided by NTT DATA Japan Corporation, to calculate GHG emissions based on the GHG Protocol*. We are working to further reduce the Group’s Scope 1 (direct emissions from fuel combustion and production processes) and Scope 2 (indirect emissions from electricity, heat, and steam use) associated with the Group’s energy use through further promotion of energy conservation and the introduction of renewable energy. For Category 1 (purchased goods and services) and Category 2 (capital goods) of Scope 3, we used the total emissions allocation method based on emissions intensity by supplier, in order to perform a calculation that incorporates our suppliers’ reduction efforts. We will continue to promote decarbonization initiatives in cooperation with our suppliers and demonstrate high supplier engagement, thereby contributing to the achievement of net zero across society as a whole.
Moreover, Scope 3 Category 15 (GHG emissions of the borrower), which accounts for the majority of total GHG emissions, can be calculated using either the top-down method, which estimates GHG emissions based on the financial data of the borrower, or the bottom-up method, which calculates GHG emissions based on the actual emissions of the borrower. We recognize the need to increase the ratio of calculations based on the bottom-up method in order to improve data quality, which is considered important in the PCAF standard, and we are working on calculations that enable customers to visualize their reduction efforts. We recognize that regional financial institutions are expected to play a role in realizing decarbonization throughout the region by using the results of these calculations to help customers calculate and reduce their emissions, and we will continue to provide tools to help customers calculate their GHG emissions and provide post-calculation reduction support.
- *GHG Protocol: An international standard used to calculate and report GHG emissions
Group GHG emissions (FY2024)
| Calculation item | Details | Calculation result (t-CO2) | Percentage (%) | ||||
|---|---|---|---|---|---|---|---|
| Scope 1 | Emissions from gas and gasoline use | 1,560 | 0.02 | ||||
| Scope 2 | Emissions from electricity use | 5,140 | 0.05 | ||||
| Scope 3 | 9,786,499 | 99.93 | |||||
| Category 1 | Purchased goods and services | 14,623 | 0.15 | ||||
| Category 2 | Acquired capital goods | 6,099 | 0.06 | ||||
| Category 3 | Fuel and energy-related activities | 6,238 | 0.07 | ||||
| Category 4 | Upstream transportation and distribution | Included in Category 1 | ― | ||||
| Category 5 | Waste generated in operations | 137 | 0.00 | ||||
| Category 6 | Business travel | 362 | 0.00 | ||||
| Category 7 | Employee commuting | 1,856 | 0.02 | ||||
| Category 8 | Upstream leased assets | Included in Scopes 1 and 2 | ― | ||||
| Category 9 | Downstream transportation and distribution | Included in Category 1 | ― | ||||
| Categories 10, 11, 12 | Processing, use, and end-of-life treatment of sold products | N/A | ― | ||||
| Category 14 | Franchises | N/A | ― | ||||
| Category 15 | Investments | 9,757,184 | 99.63 | ||||
-
Notes:
Scope 1 and 2 emissions are calculated for the entire Group.
The calculations for Scope 3 (excluding Category 15) were performed for the Company and the Bank of Kyoto.
For Category 15, calculations were performed for listed shares and corporate bonds, business loans, and project finance of the Bank of Kyoto.
The coverage ratio of the calculation results against the subjects is 93.1% on a balance basis.
'N/A' indicates that there are no applicable emissions.
Category 13 is not calculated.
Scope 3 Category 15 calculation results by industry
| Industry | Emission (t-CO2) |
Carbon intensity (t-CO2/JPY mn) |
Data quality score (DS) weighted average |
|
|---|---|---|---|---|
| Energy | Oil and gas | 158,050 | 2.05 | 2.50 |
| Coal | ― | ― | ― | |
| Power utilities | 580,760 | 15.15 | 2.53 | |
| Transportation | Air cargo | 4,690 | 2.26 | 3.83 |
| Passenger air transportation | 36,507 | 6.73 | 1.00 | |
| Marine transportation | 134,622 | 11.65 | 1.12 | |
| Rail transportation | 42,470 | 2.01 | 1.80 | |
| Truck services | 284,596 | 3.42 | 3.77 | |
| Vehicles and parts | 231,677 | 0.91 | 2.08 | |
| Materials and buildings | Metals and mining | 497,624 | 5.41 | 2.65 |
| Chemicals | 607,861 | 3.45 | 2.45 | |
| Building materials | 150,617 | 7.78 | 2.45 | |
| Capital goods | 2,822,973 | 2.56 | 2.44 | |
| Real estate management and development | 110,938 | 0.83 | 3.10 | |
| Agriculture, food, and forest products | Beverages | 26,073 | 3.50 | 3.88 |
| Agriculture | 44,832 | 4.44 | 3.80 | |
| Processed foods and meats | 291,916 | 3.34 | 3.39 | |
| Paper and forest products | 177,477 | 3.81 | 3.07 | |
| Other | 3,553,503 | 1.75 | 2.54 | |
| Total | 9,757,184 | ― | 2.55 | |
- Note:Calculated based on the balance of the Bank of Kyoto’s investments and loans subject to the calculation as of March 31, 2025.
〈Comparison with FY2023 calculation results〉
The Group has been calculating Category 15 since FY2023, and the difference from the FY2024 calculation results is shown below.
FY2023 Total Category 15 emissions: 8.6 million tons (calculation rate: 94.1%), Data quality score: 2.87
FY2024 Total Category 15 emissions: 9.76 million tons (calculation rate: 93.1%), Data quality score: 2.55
The difference content consists of the following.
- (1)Change due to replacement of investment and loan portfolio, etc.: +348,000 tons
Impact of the overall increase in the amount of investments and loans. We recognize that there is no problem per se with an increase in Category 15 due to an increase in the amount of investments and loans.
Since many of our new customers have not yet calculated their emissions (Data quality score: 4), we will encourage them to do so. - (2)Change due to the calculation of emissions by investees: -86,000 tons
Impact of the change from top-down estimates, which tend to have larger emissions, to bottom-up primary data, as customers have calculated their emissions.
We will continue to support our customers in calculating their emissions and will work to reduce emissions. - (3)Change due to increase/reduction of emissions by investees: +891,000 tons
In the calculation based on top-down estimates, emissions will increase or decrease as customers’ sales increase or decrease, regardless of the actual business activities.
In addition, in the calculation based on bottom-up primary data, emissions may increase or decrease due to changes in the volume of business activities, as well as changes in the scope of calculation due to business acquisitions and sales, etc.
Therefore, we will promote decarbonization consulting services, including support for emissions calculations and emissions reductions, by confirming the reasons for increases or decreases in customers’ emissions.
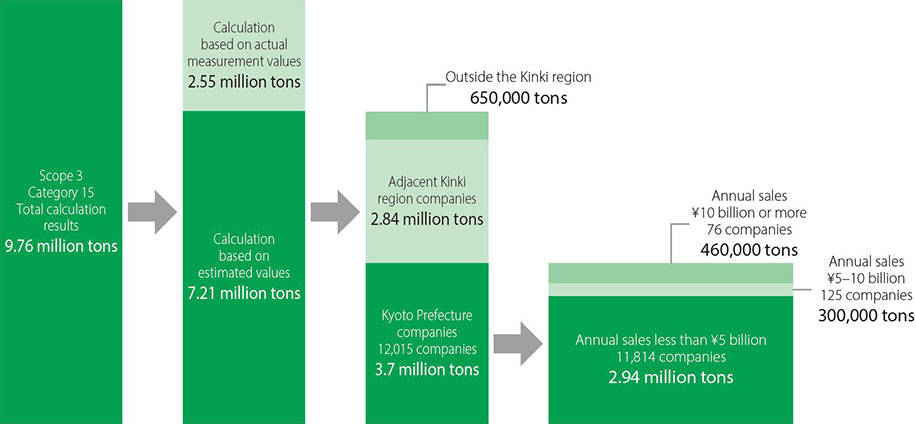
Further promoting regional decarbonization through collaboration with business partners who are leading the way
The 9.76 million tons of Category 15 emissions of the Group are broken down into 2.55 million tons based on actual measurement values (primary data use) and 7.21 million tons based on estimated values (secondary data use). Of these, the emissions of companies with headquarters in Kyoto Prefecture are calculated based on actual measurements (using primary data) at 420,000 tons (approximately 100 companies) and based on estimates (using secondary data) at 3.7 million tons (approximately 12,000 companies).
We will continue to play a role in promoting regional decarbonization, which is expected of regional financial institutions, by obtaining cooperation from leading companies that have already calculated emissions and encouraging companies that have not yet done so to calculate their emissions and promote reduction measures that take into account the types of businesses of our customers.
“Breakdown of Category 15 calculation results”
Calculation method of Category 15, etc.
Calculation Formula


Emissions calculation methods
Top-down method:
Emissions are calculated based on the Ministry of the Environment’s “Database on Emissions Unit Values for Accounting of GHG Emissions, etc., by Organizations Throughout the Supply Chain (Ver. 3.5).”
Bottom-up method:
Calculated based on the GHG emissions and other data (primary data) disclosed by the investee.
Data quality score (DS)
The PCAF standard, which was the calculations were based upon, defines the data quality scores as shown in the table below to evaluate the quality of estimated emissions.

| DS | Emissions calculation method | Type of emissions |
|---|---|---|
| Score1 | Emissions reported by target company/project (with third-party certification) | Reporting basis emissions |
| Score2 | Emissions reported by target company/project (without third-party certification) | |
| Energy consumption of target company x Emissions intensity | Estimated emissions based on activity indicators | |
| Score3 | Production volume of target company x Emissions intensity | |
| Score4 | Revenue of target company x Emissions per revenue in the relevant sector | Estimated emissions based on financial indicators |
| Score5 | Investment/loan balance x Emissions per asset in the relevant sector | |
| Investment/loan balance x Emissions per revenue in the relevant sector x Asset turnover ratios in the relevant sector |